By the time a customer tells you they are leaving, the decision is usually already made. The conversation you are having is not a retention conversation. It is an exit conversation.
Customer health score is the operational tool that changes that timing. It combines usage signals, satisfaction trends, support interaction patterns, and engagement data into a single score. In real time: is this customer relationship strengthening, drifting, or approaching churn?
The customers who churn without warning were never actually silent. They were sending signals through support tickets, declining CSAT scores, rising escalation rates, and slower response times. The health score reads those signals as a pattern and converts them into an early warning before the renewal conversation is already lost.
This guide covers what a customer health score is and the four signals that make it reliable. How to build a scoring model. The red/yellow/green framework that makes the data actionable.
What Is a Customer Health Score?
A customer health score is a composite metric that quantifies the likelihood of a customer renewing, expanding, or churning. It combines usage signals, satisfaction trends, support interaction history, and engagement patterns into a single score. The goal: surface at-risk accounts 60 to 90 days before churn risk becomes visible in financial metrics.
Customer health scores originated in SaaS customer success management, where they are used to track product adoption, feature usage, and licence utilisation. The same logic applies directly to customer service operations. The signals that predict whether a B2B customer renews are largely generated by the support interaction history, not just the product usage data.
A health score is not a satisfaction score. CSAT measures how a customer felt about one interaction. A health score measures the trajectory of the relationship across dozens of interactions over time.
A customer can rate individual interactions 4 out of 5 while their overall health score is declining. Escalation rate rising, response time slowing, ticket volume increasing. Three patterns that individually look like operational noise but together signal churn risk.
Companies using predictive health scoring report 27% lower gross churn than those relying on rule-based or single-metric scoring alone. And based on existing research, acquiring a new B2B customer costs 5 to 7 times more than retaining one. The health score is the early warning system that makes the economics of retention actionable rather than aspirational.
Why a Single Metric Is Not Enough to Predict Churn
The most common mistake in health scoring is relying on a single signal. Three failure modes show why each metric alone is insufficient.
1. CSAT Alone Misses Process Drift
A customer who rates interactions positively but has filed 12 tickets in 30 days is not satisfied with the overall experience. The high CSAT is measuring agent quality. The ticket volume is measuring product or process friction. CSAT alone will not catch the drift.
2. Ticket Volume Alone Misses Sentiment.
A customer with low ticket volume who is dissatisfied has stopped asking for help. Often because past requests produced no resolution. Low ticket volume is not always a sign of a healthy account. Sometimes it is a sign of a customer who has given up on support and is already looking at alternatives.
3. Usage Alone Misses Relationship Quality
Based on existing research, high product usage does not always mean a healthy customer. A customer might engage heavily because your product requires constant manual work to accomplish basic tasks. Usage is a meaningful signal. On its own, it is not sufficient.
The health score works because it triangulates. A single degrading signal is noise. Two degrading signals on the same account warrant attention. Three or more degrading signals together constitute a risk pattern that predicts churn with far more accuracy than any individual metric can achieve.
73% of CS leaders say their current health score does not reliably predict churn. Almost always because of data quality issues or over-reliance on a single metric, not because the health scoring approach is flawed. The solution is a multi-signal model built on clean, real-time data.
The Four Signals That Power a Reliable Health Score
The brief for this article specifies four signal types. Each captures a different dimension of customer health. Each has blind spots that the others compensate for.
1. Usage Signals
Usage signals measure how actively and deeply the customer is engaging with your service or product. For CS operations, the relevant usage signals are: contact volume trend over 30-day rolling windows, channel mix consistency, and service adoption depth.
A customer whose contact volume has declined by 30% over the past 60 days may have resolved their friction. Or they may have stopped contacting support because prior contacts did not produce results. Usage signal interpretation requires context: cross-reference against CSAT trend and response time to distinguish disengagement from resolution.
The directional trend matters more than the absolute number. A customer at 15 monthly contacts trending upward is generating a different signal than a customer at 40 contacts trending steadily downward. Build usage signals into the health score as trend measurements, not point-in-time counts.
2. CSAT Trend
A single CSAT data point tells you how one customer felt about one interaction. The CSAT trend over 90 days tells you whether the relationship is improving, stable, or eroding.
A CSAT trend declining from 85% to 72% to 65% over three months is a health signal even when no individual interaction triggered an escalation. The declining trend reflects accumulated micro-frustrations that no single ticket captures. Slight delays, repeated context, marginally unhelpful responses. Each one below expectation. None severe enough to escalate. All together a pattern that predicts churn.
For teams using CES alongside CSAT in their health score, the Customer Effort Score trend is a stronger churn predictor at the interaction level — adding it as a signal adds predictive depth. Track CSAT trend as a 90-day rolling average by account, segmented by interaction category. Based on existing research, customer service KPIs tracked at the right granularity are what separate teams that continuously improve from those that plateau. For health scoring, that granularity is the account-level CSAT trend, not the team-wide average.
For accounts where CSAT and Net Promoter Score diverge — high NPS but declining CSAT — the account has residual brand goodwill that is being eroded by day-to-day service interactions. This divergence is one of the most predictive churn signals in a health scoring model.
3. Escalation Rate
Escalation rate is the percentage of an account’s tickets that require escalation beyond the first-tier agent. It is one of the most direct signals of structural friction in the relationship.
A healthy account escalation rate is typically below 10%. An account with a 25% escalation rate is experiencing recurring situations where tier-one resolution is insufficient. That pattern signals one of three things. The account’s queries are growing in complexity. The knowledge infrastructure supporting tier-one agents is insufficient for this account. Or the account is experiencing a product or policy issue that generates systematically escalatable queries.
Based on existing research, escalation rate by category is one of the highest-leverage metrics in customer service because it directly reveals where the gap between customer expectation and company capability is largest. In health scoring, escalation rate is weighted more heavily for accounts where high escalation rate persists across multiple consecutive months — because that pattern reflects a structural gap, not an isolated complex query.
Track escalation rate by account with a 60-day trend. An escalation rate that jumped from 8% to 22% in a single month warrants investigation. A rate that trended 8% to 12% to 18% to 22% over four months is a health score red flag.
4. Response Time
Response time signals measure two things: how quickly your team responds to the account’s contacts, and how quickly the account responds to your outreach. Both directions matter.
Customer service standards that define response time commitments and enforce them consistently protect relationship quality. For health scoring, SLA breach rate by account is a direct input. An account with a 15% SLA breach rate is receiving a demonstrably lower quality of service than contracted.
The account’s response time to your outreach. Customers engaged with the relationship respond. Customers disengaging go quiet.
Track response latency on outreach from account management as a health signal. A trend of increasing days-to-response is a yellow flag before any other signal has moved.
How to Build a Customer Health Score
A customer health score is only valuable if it is simple enough to trust and accurate enough to predict risk. Rather than combining dozens of metrics, focus on a small set of indicators that consistently reflect customer satisfaction, engagement, and renewal likelihood.
The five steps below provide a practical framework for building a health score that supports proactive customer success.
1. Define What Healthy Means for Your Customer Segment
Healthy looks different for enterprise accounts than for SMB accounts. An enterprise account on a three-year contract engaging with a dedicated account team has different health indicators than an SMB on a monthly subscription with no assigned CSM.
Build segment-specific health definitions before assigning metric weights. For enterprise accounts, relationship depth carries more weight. For SMB accounts, usage consistency and CSAT trend carry more weight. Apply one scoring model to all segments and the score becomes an average that misleads in both directions.
2. Choose Three to Five Signals per Category
Start with a focused signal set. The four categories above, usage, CSAT trend, escalation rate, response time, provide a solid foundation. Add a fifth signal from a second category if your data quality supports it.
Common additions: ticket reopening rate (a proxy for resolution quality), channel switch frequency (a proxy for friction in the primary channel), and days since last positive engagement.
Scaling customer support effectively requires data infrastructure that surfaces specific operational gaps. Three to five signals gives you enough coverage without creating a model no one can interpret or trust.
3. Normalise Each Signal to a 0–100 Scale
Raw metrics cannot be combined directly. An escalation rate of 15% and a CSAT score of 72% are in different units with different directional meanings. Normalise each signal to a 0–100 health sub-score before weighting.
For escalation rate: 0% = 100 health points. 25%+ = 0 health points. Scale linearly between. For CSAT trend: 90%+ = 100 health points. Below 60% = 0 health points. Scale between. For response time: 100% SLA compliance = 100 health points. 80% SLA compliance = 20 health points. For usage trend: Stable or growing = 100. Declining more than 30% = 0.
4. Assign Weights Based on Churn Prediction Value
Not all signals predict churn equally. In most B2B service operations, CSAT trend and escalation rate are the strongest predictors. Assign them higher weights in the composite score.
A simple starting weight distribution:
- CSAT trend: 35%
- Escalation rate: 30%
- Usage signals: 20%
- Response time: 15%
Adjust weights after 90 days of data by comparing health score predictions against actual churn and renewal outcomes. Based on existing research, AI in customer service platforms that update health score models automatically based on prediction accuracy improve churn prediction rates over time. Start with manual weights and adjust quarterly.
5. Set Update Cadence and Review Frequency
A health score that updates monthly is a lagging indicator. An account can decline from green to critical in three weeks. Update scores weekly at minimum, daily for high-value accounts.
Set review cadences by segment. Weekly review of all red accounts. Bi-weekly for yellow. Monthly for green. Assign ownership: which team acts on each score tier? The score is only useful if it reaches the person with the authority and capability to respond.
An effective customer health score is not just a reporting metric, it is an early warning system. When built from the right signals, updated regularly, and connected to clear ownership, it helps teams identify at-risk accounts before they churn and prioritise interventions that improve retention, customer satisfaction, and long-term growth.
The Red, Yellow, and Green Model
The red/yellow/green (RAG) model translates the composite health score into an action tier. Three tiers are sufficient for most operations. More tiers produce decision paralysis.
| Tier | Score Range | Signal Pattern | Churn Risk |
| 🟢 Green | 75–100 | CSAT stable or improving, escalation rate low, usage stable, SLA compliance strong | Low — likely to renew |
| 🟡 Yellow | 50–74 | CSAT declining trend, escalation rate rising, usage slightly declining, occasional SLA breach | Moderate — needs proactive attention |
| 🔴 Red | Below 50 | CSAT below 65%, escalation rate above 20%, usage decline over 30%, repeated SLA breaches | High — active churn risk |
1. Green
A green account is receiving consistent value from the relationship. CSAT above 80% for 90 days. Escalation rate below 10%. Usage stable or trending upward. SLA compliance on their tickets has been above 95%. Outreach response time is normal.
Green does not mean inactive. It means the primary CS activity should be expansion, not retention.
2. Yellow
A yellow account has at least two degrading signals trending toward red. CSAT declining from 82% to 74% over 60 days. The escalation rate has risen from 9% to 16%. Usage is slightly down. The account’s response time to outreach has extended from two days to five.
No individual signal is alarming. The combination and direction are. That is the signal.
Proactive customer service that identifies and addresses these patterns before they compound consistently produces better retention outcomes than reactive service that waits for a direct complaint or a missed renewal conversation.
3. Red
A red account has three or more degrading signals that have already passed threshold values. CSAT below 65%. Escalation rate above 20% with a rising trend. Usage declined by more than 30% over 60 days. Two or more SLA breaches in the past month. Outreach response time above ten days. The account has submitted multiple high-severity tickets in the past 30 days.
A red account needs escalation to account management within 48 hours of the score dropping below threshold. Not at the next monthly review.
How to Act on Customer Health Score Data
A customer health score creates value only when it drives timely action. Each score tier should trigger a clear response that helps strengthen healthy accounts, recover at-risk customers, and prevent churn.
The score is only as valuable as the action protocols connected to it.
1. Green Accounts: Expand, Advocate, Deepen
Green accounts are your expansion pipeline and your advocacy source. The CS activity for green accounts is not retention management. It is identifying which capabilities the account is not yet using, which adjacent problems your product or service can solve, and whether the account is a candidate for a case study, referral, or co-marketing conversation.
Green accounts are also your most valuable signal for what a healthy relationship looks like. Review the inputs that produced the green score for your top accounts and ask: which specific practices are producing this outcome? That analysis informs how you raise yellow accounts toward green.
2. Yellow Accounts: Investigate, Intervene, Prevent
Yellow accounts require a scheduled proactive outreach within one to two weeks of the score moving into the yellow zone. The outreach is not a check-in. It is a structured investigation: which specific signal degraded, what is the likely cause, and what operational change would address it?
A CSAT decline is the starting point, not the answer. The investigation traces it to the specific interaction category or agent team where it originated. An escalation rate increase traces to the specific query category generating the escalations. Once the root cause is identified, the response is operational. A knowledge base update, a routing rule change, a training session, a policy clarification. Not a relationship reassurance call.
In our voice of Customer strategy article, yellow account patterns are one of the highest-value VoC signals available because they represent customers with enough remaining goodwill to stay but enough accumulated friction to leave. Acting on yellow account health data within two weeks of detection converts yellow to green rather than letting yellow drift to red.
3. Red Accounts: Escalate, Audit, Commit
Red accounts require a different response protocol than yellow. The health score decline is already significant. A check-in is insufficient. Three actions within 48 hours of red designation:
- Escalation to account management or CS leadership. The red account moves from the standard CS queue to active account management oversight. An account manager or CS leader takes ownership of the resolution plan.
- Root cause audit. Pull the full 90-day interaction history for the account. Map every signal that degraded. Identify the first signal that moved and when. Establish whether the cause is operational (a CS process or tooling failure) or relational (a change in the account’s internal structure, priorities, or stakeholders).
- A specific commitment within 72 hours. Not a general assurance. A specific operational commitment: “We have identified that your billing query category has a 28% escalation rate, which is above our 10% target. By end of this week, we will have updated the knowledge base for this category and assigned a specialist agent to all billing queries from your account for the next 30 days.” The commitment is specific, time-bounded, and measurable.
The goal is not simply to classify accounts as green, yellow, or red, but to ensure every score leads to a defined operational response. When paired with clear ownership and consistent follow-up, customer health scores become a practical tool for improving retention and long-term customer success.
How Qiscus Reporting Feeds Your Health Score
A customer health score is only as reliable as the data feeding it. The four signals above are all generated by the CS support operation. The infrastructure that captures and surfaces those signals determines whether the health score is a real-time decision tool or a monthly manual compilation.
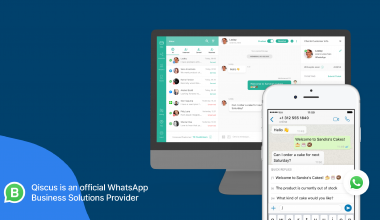
Qiscus is an agentic customer engagement platform. The unified omnichannel workspace consolidates every customer interaction into a single customer profile. Every signal generated in any channel writes to that profile in real time. No manual consolidation required.
CSAT trend by account. Every post-interaction CSAT survey response is logged against the specific ticket, agent, channel, and account it follows. Account-level CSAT trend over 30, 60, and 90 days is available in the helpdesk reporting layer without manual data compilation.
1. Escalation Rate by Account
Every escalation trigger, its ticket category, its resolution path, and whether the customer re-contacted on the same issue, all logged automatically and reportable by account over any time period. Escalation rate trend by account is a standard report, not a custom query.
2. SLA Compliance by Account
SLA clocks run on every ticket from the moment of creation. SLA breach rate by account, by channel, and by ticket category is available in real time. A health score that uses SLA compliance as an input draws directly from automated SLA data rather than from manual tracking.
3. Response Time Tracking
Average first response time by account and average resolution time by account are standard Qiscus Helpdesk Suite reports. The trend direction, whether the account’s average response time is improving, stable, or degrading, is the input the health score needs.
Panorama JTB cut their response time by 70% after implementing Qiscus. For health scoring purposes, that improvement means their accounts’ response time signal moved from a consistent yellow or red input to a consistent green input — improving composite health scores across the account base.
Bank Raya cut their resolution time by 97.6% after implementing Qiscus Helpdesk Suite. Resolution time is a direct escalation rate input: tickets that resolve faster and more completely produce fewer follow-up escalations, which directly improves the escalation rate component of the health score.
For teams building the full customer intelligence loop from health score signals through to operational changes, our guide to improving customer support covers the specific interventions that translate health score findings into measurable service improvement.
Build a Smarter Customer Health Score System with Qiscus
The number matters less than what the number triggers.
The most common health scoring failure is not a methodology problem. Based on existing research, most CS leaders whose health scores do not reliably predict churn identify data quality as the root cause, not the scoring logic itself. The signals need to be clean, current, and account-level. That requires the infrastructure to capture every interaction signal across every channel in real time. That is the starting point.
That infrastructure is the unified omnichannel workspace and helpdesk reporting layer that Qiscus delivers. The health score model sits above it. The action protocols for each tier sit above that. But the data quality that makes the whole system reliable starts at the channel-level signal capture layer.
Build the infrastructure first. Then the model. Then the protocols. In that order.
Explore how Qiscus supports customer health score data infrastructure for teams managing omnichannel CS operations at scale.
Frequently Asked Questions
CSAT measures how a customer felt about a specific interaction, it is a point-in-time satisfaction measurement for one conversation or ticket. A customer health score measures the overall health of the customer relationship across all interactions over time. It combines CSAT trend alongside usage data, escalation rate, and response time to produce a composite view that predicts whether the customer will renew, expand, or churn. CSAT is one input into a health score. The health score is the strategic layer that contextualises CSAT within the full relationship.
Weekly at minimum. For high-value or enterprise accounts, daily updates are preferable. A health score that updates monthly is a lagging indicator, an account can move from green to critical in three weeks, and a monthly update would miss the window for effective intervention. Automated scoring systems that pull data from the helpdesk and CRM in real time are the only viable approach for teams managing more than 50 accounts simultaneously.
Three to five signals is the right range for most operations starting a health scoring programme. The goal is a model simple enough for every CS team member to understand and trust, and comprehensive enough to catch the risk patterns that single metrics miss. Start with the four signals in this guide, usage, CSAT trend, escalation rate, and response time, and add a fifth only when you have 90 days of data to validate whether it improves prediction accuracy.
Ownership typically sits with customer success operations or CS leadership. The health score is a strategic tool that requires cross-functional data: CS operations provides the support interaction signals, account management provides the relationship signals, and product teams provide the usage signals. The CS ops team typically owns model design and maintenance. CS managers own the action protocols for each score tier. Account management owns execution on red accounts.
A Voice of Customer programme captures what customers say, through surveys, support tickets, social listening, and direct feedback, and routes those insights to the teams that can act on them. A customer health score calculates what customer behaviour indicates about the relationship trajectory. The two are complementary: VoC data provides the qualitative context that explains why a health score is moving, while the health score provides the quantitative signal that tells you which accounts need attention. For more on how VoC programmes feed customer intelligence, see our guide to building a Voice of Customer strategy at the link above.